When a processor has a fault it can leave what looks to be precious little in the way of cause and effect. Debug-by-print-statement works surprisingly well in simple cases, but where in a desktop environment you would drop into a debugger to solve trickier problems this can be an onerous task on an embedded system. [Ross Schlaikjer]’s excellent blog post walks through setting up one of our favorite Open Hardware debug probes and shows us that with the right tooling in place, unexpected faults aren’t quite so impenetrable.
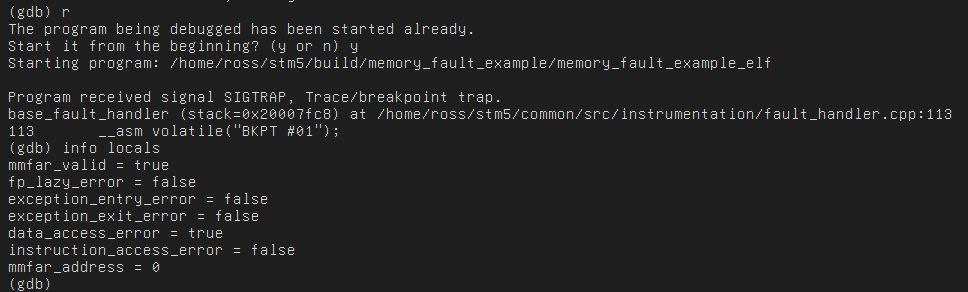
As it turns out, when a CPU faults it doesn’t blow away all its state. In fact, the fault handler is just another piece of code! It may not be safe to print, but through a debugger you can extract working registers to determine the cause of the fault and other state like what the last instruction was that the CPU was running before it happened! This can be done painstakingly with manual debug work, or you can following along with instructions like [Ross]’s and setup some clever code to extract the relevant values automatically. He provides an understandable explanation of what registers are interesting and how to put together structs to extract the values from them. Here at Hackaday we’re simple people, so besides the bitmask indicating fault type our favorite is the Link Register, which holds the address to return to (AKA the address which caused the fault!). There are a couple of other neat tricks like using the assembly instruction “BKPT #01” to force the debugger to breakpoint.
If this tickled your fancy and you want more conversation about embedded development, we spent some time discussing it and other topics on the Hackaday Podcast episode 31.
No comments:
Post a Comment