A recent post about debugging constructs surprised me. There were quite a few comments about how you didn’t need a debugger, as long as you had printf. For that matter, we’ve all debugged systems where you had nothing but an LED to flash or otherwise turn on to communicate with the user. However, it is hard to deny that a debugger can help with complex code.
To say you only need printf would be like saying you only need machine language. Technically accurate — you can do anything in machine language. But it sure makes things easier to have an assembler or some language to help you work out your problem. If you write a simple bash script, you can use the equivalent to printf — maybe that’s the echo command, although there is usually a printf command on a typical system, if you want to use it. However, there are other things you can do with bash including a pretty cool debugger if you know how to find it.
I assume you already know how to use echo and printf, but let’s dig into how to use trace execution line by line without the need for echo statements on every other line. Along the way, you’ll learn how to get started with the bash debugger.
Tracing
It isn’t always easy to read, but you can get a trace of the entire execution of a running script by adding the -x option to its invocation of bash. There are at least three ways to do this. First, you can do a set -x in your current session. The problem with this is that any fancy things you have happening in your shell prompt will show up, too. That makes the output even harder to read. If you do brave this method, you can turn the tracing back off at a shell prompt with set +x.
#!/bin/bash -x
for I in {1..10}
do
   banner $((9-I)) - HAD
   echo
   echo
   echo
done
 You can add also add the flag when executing the script from the command line:
 bash -x ./had.sh or to the shebang on the first line of your script. Usually, you’ll have #!/bin/bash at the top of the file, just add the -x on that line.
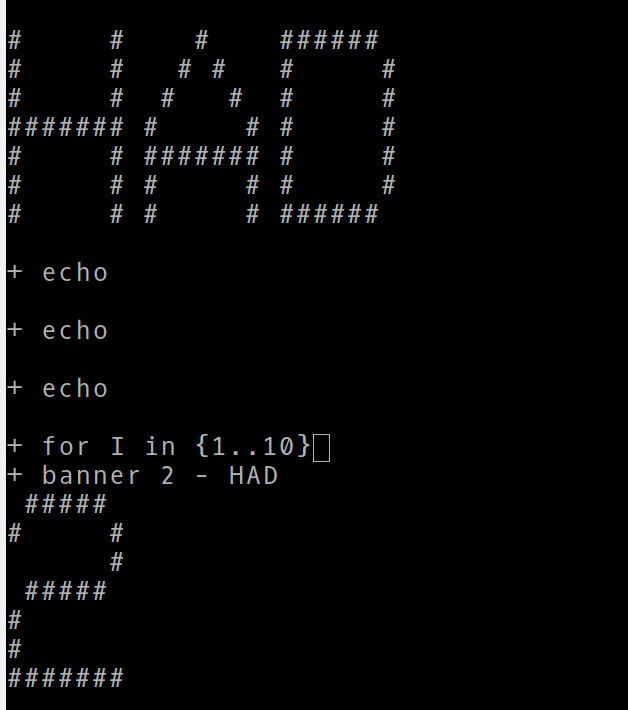
For example, the following script has a few errors in it. I put the -x at the top, so if you run it, you’ll see what the trace looks like. Note the lines that start with a plus sign. That’s the line of the script that is executing. The other lines are actually output from the script.
Installing the Bash Debugger
There is a bash debugger available. However, Ubuntu and similar distributions haven’t included it in their software repos for awhile. You can, of course, go get it yourself. You’ll want to know what version of bash you are using (try bash --version). Download the version that matches what you have and follow the instructions.
The debugger itself is written in bash. It uses a special trap that fires at the end of each statement that is there especially for debugging. In theory, you could create your own debugger using that trap, but it is quite a bit of work.
Using the Debugger
There are at least two ways to invoke the debugger. You can run it along with the name of the script which is pretty safe: bashdb had.sh.
The only problem with this is that it can confuse $0 and the script itself shows up in the call tree. Running bash with the –debugging option will also run the program, or at least it should. It works for me, but anecdotally, some people have trouble with this method.
If you ask for help on the bashdb program, there are plenty of options, but none you’ll use often. Inside the program, you have commands similar to gdb commands. You can review them all by typing “help” at the prompt.
Asking for help in the bashdb program will show how to set breakpoints, look at backtraces or even have commands run when certain conditions are met. Quite a few of these commands worth further investigation:
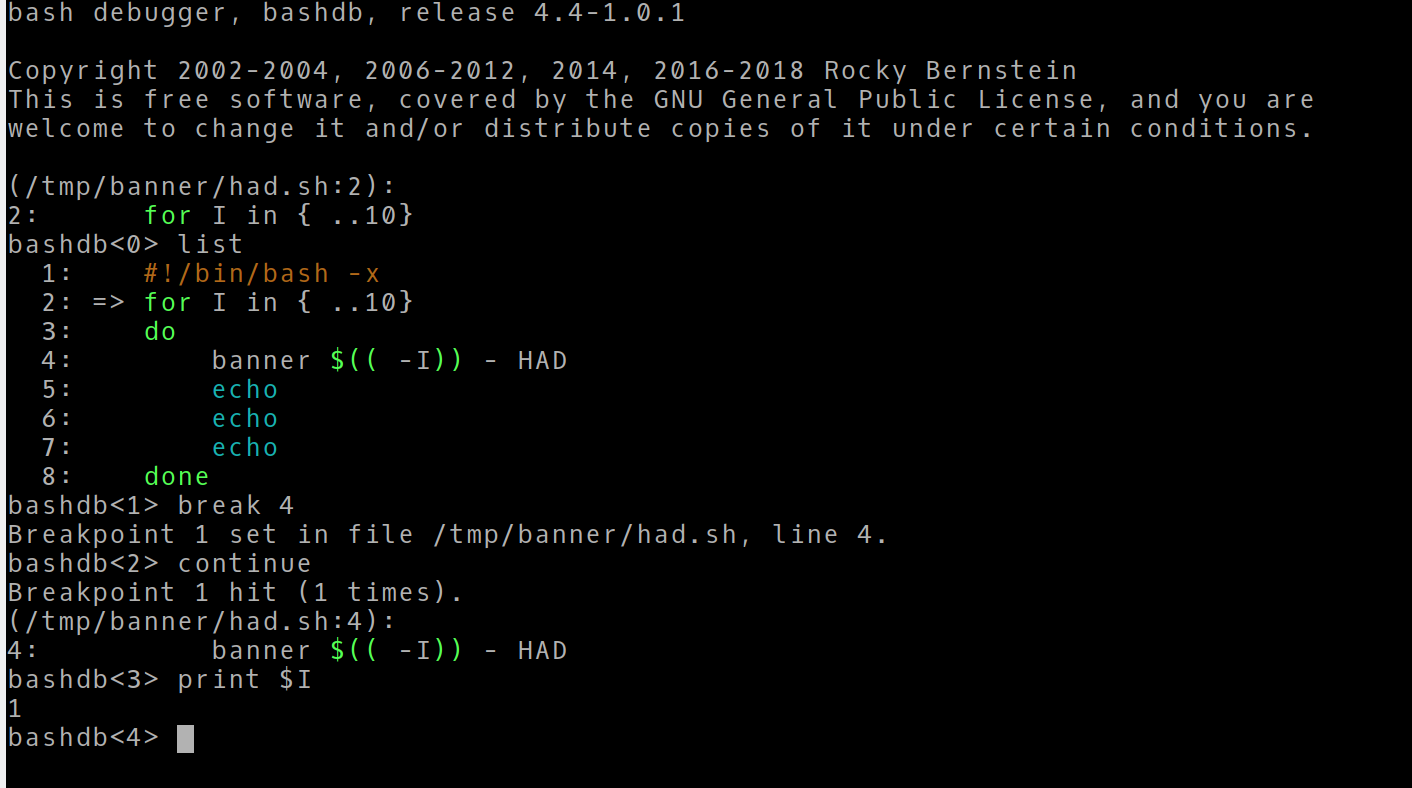
- list – Shows the script with line numbers
- break – Set a breakpoint on a line (note: tbreak sets a one-time breakpoint)
- backtrace – View call stack
- condition – Sets up a conditional breakpoint
- display – Set up to print a variable before each stop
- handle – Set up trap handling
- step, next, skip – Single stepping commands
- trace, untrace – Like the -x argument
- watch, watche – Set up watches
The debugging process is a familiar one. Whether single-stepping through code, or setting break points to pause the program flow, this lets you track down problems with much more flexibility than echoing out information would.
There are two things wrong with my script. Well, at least two things. First, I meant for the banner to count down: 10, 9, 8, etc. I also wanted everything on one line. One of those is easy to find with the debugger.
If you want a video walkthrough, the one below is pretty old, but still good.
The best way to not have to debug shell scripts is to not put bugs in to start with. There are tools to help you strive for that. Then again, you could write your shell scripts in C.
No comments:
Post a Comment