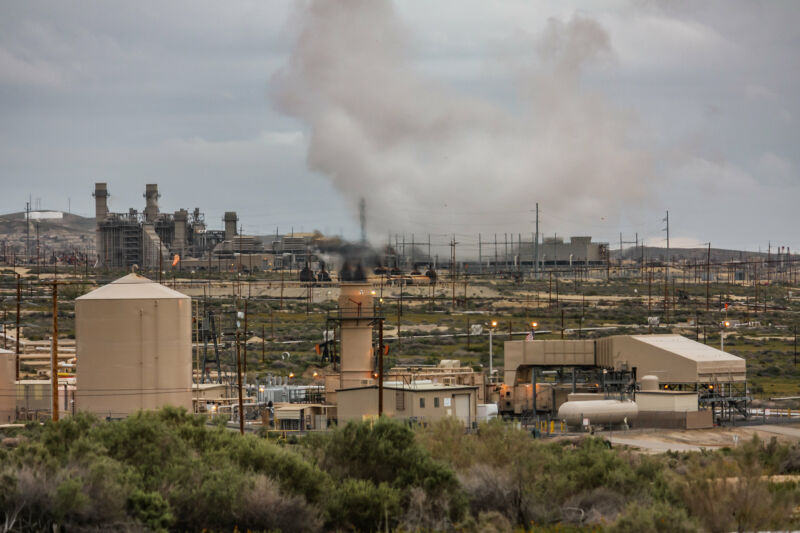
Enlarge (credit: David Seibold)
It’s called the “bomb curve”—a drastic spike in the amount of radioactive (but harmless) carbon-14 in the atmosphere, ushered in by the nuclear age. Scientists can sometimes utilize it as a marker in time when it’s captured by something like tree rings, for example. But the bomb curve can also obscure answers by muddying the waters. That includes the question of just how much methane emissions human activities have released.
The bomb curve
Different sources of methane emissions, ranging from plant decay in wetlands to bubbling seeps around mud volcanoes, come with different signatures of carbon isotopes. Geological sources of methane are quite old, giving any carbon-14 plenty of time to radioactively decay and disappear. Carbon in methane from recently alive plant material, on the other hand, will still have about the same amount of carbon-14 we find in the atmosphere (where it is continually produced).
So if the share of carbon-14-bearing methane in the atmosphere were to decrease, you could determine that “old carbon” methane emissions were increasing. The “bomb curve” ruins that trick by introducing a new variable that has nothing to do with categories of methane emissions. And that has made it harder for researchers to figure out how certain natural sources of methane compare to human-caused emissions. We know how much is going into the atmosphere, but we don’t quite know exactly how much of it is our fault.
No comments:
Post a Comment